xdebug是一個Open Source的php debug工具,可以用來追蹤分析PHP程式運行的情況。
安裝 xdebug
A. 確認所需下載的版本
xdebug官方網站提供了一個方便的功能,只要將phpinfo() 所得的結果貼到find-binary網頁,讓其來分析結果就可以得到要下載的檔案版本。
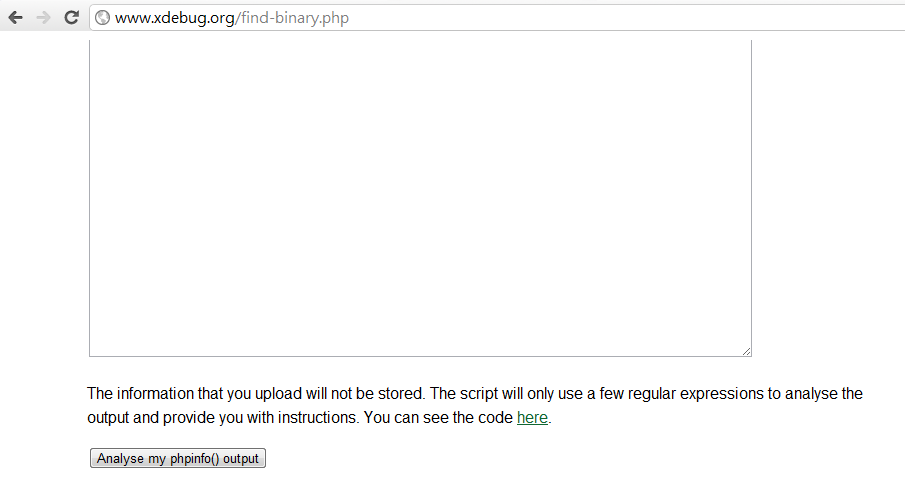
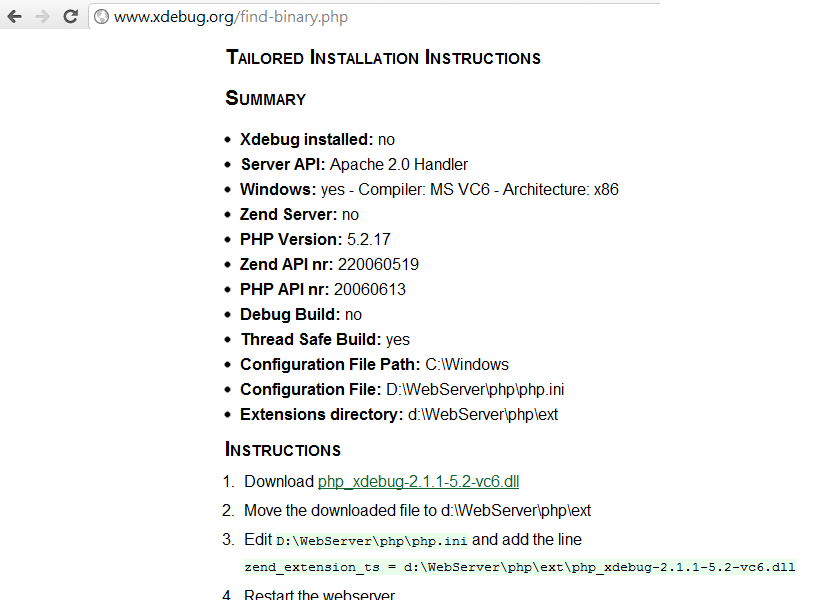
網頁會明確抓到系統以建置的環境並告知所需執行的步驟:
1. Download php_xdebug-2.1.1-5.2-vc6.dll
2. Move the downloaded file to d:\WebServer\php\ext
3. Update D:\WebServer\php\php.ini and change the line
zend_extension_ts = d:\WebServer\php\ext\php_xdebug-2.1.1-5.2-vc6.dll
4. Restart the webserver
B. 安裝及修改php.ini
將從下載網頁下載到php_xdebug-2.1.1-5.2-vc6.dll複製到d:\WebServer\php\ext目錄下後,修改php.ini,在檔案最下方新增下列設定:
[Xdebug]
zend_extension_ts="D:\WebServer\php\ext\php_xdebug-2.1.1-5.2-vc6.dll"
xdebug.profiler_enable=on
xdebug.show_local_vars=on
xdebug.trace_output_dir="D:/WebServer/temp/xdebug"
xdebug.profiler_output_dir="D:/WebServer/temp/xdebug"
存檔後,需重啟Apache來確認更新內容,在新的phpinfo()中就可以看到xdebug相關資訊。
使用xdebug
使用個簡單程式來體驗xdebug
testXdebug.php
<?php
// Control xdebug on/off
//xdebug_disable();
testXdebug();
function testXdebug() {
includeFile();
}
function includeFile() {
require_once('notexist.php');
}
?>
透過xdebug_disable()來開關xdebug
*未使用xdebug時,原生落落長又看不清的錯誤訊息
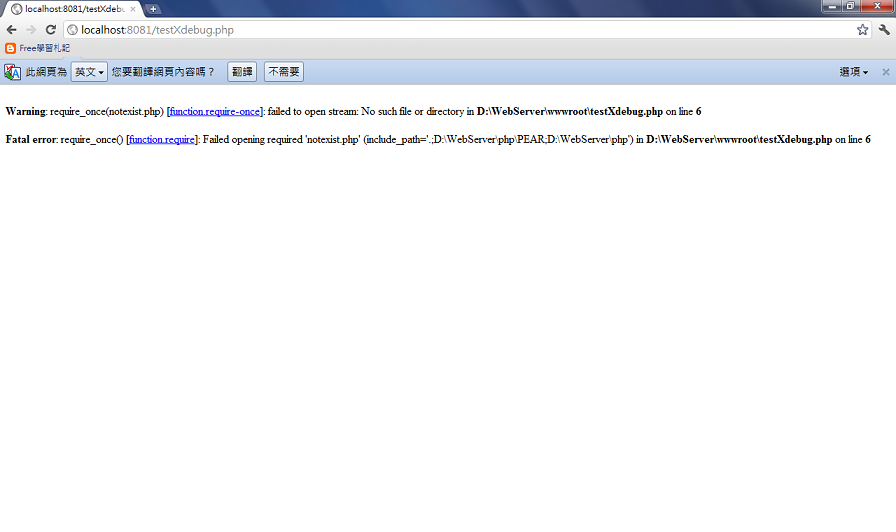
*使用xdebug來到嶄新的彩色頁面
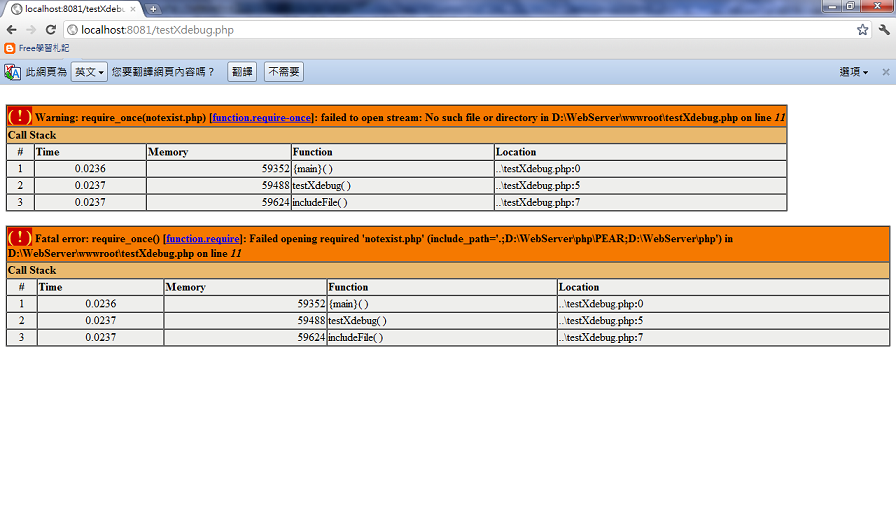
xdebug顯示就像JAVA Exception追蹤回溯一樣,可以一步步快速正確定位到錯誤位置來快速解決問題。
xdebug設定說明
所有的設定說明請參考http://www.xdebug.org/docs/all_settings,裡面有全部設定的詳細說明。
下列只說明幾個重要設定:
xdebug.profiler_enable
預設是on,用來開放xdebug權限,讓其將個資料寫入檔案,以利後續分析。
xdebug.show_local_vars
預設是關閉的(0),當此設定不等於0時,會顯示所有變數和大量訊息。
xdebug.trace_output_dir="D:/WebServer/temp/xdebug"
預設是/tmp,用來存放trace相關檔案,必須確認PHP對此目錄有存取的權限。
xdebug.profiler_output_dir
預設是/tmp,用來存放profiler相關檔案,必須確認PHP對此目錄有存取的權限。

 留言列表
留言列表
